ScaledOS is not a calculator you run once. It is a loop - diagnose your value, find what is suppressing your multiple, act on the right things, re-score, and watch the number climb. This page explains how each engine works, what it gives you, and why running it every quarter compounds over time.
You arrive, get your number, see what is suppressing it, fix the gaps, and come back each quarter to watch it move. Each pass of the loop compounds - the data sharpens, the benchmark tightens, and your EV trajectory becomes visible over time.
Answer a focused set of questions about your business - financial performance, revenue quality, team, operations, sales pipeline and more. ScaledOS tracks over 30 critical variables, from net revenue retention to client concentration, to build a complete picture of your business.
Takes around 15 minutes. No consultant required.
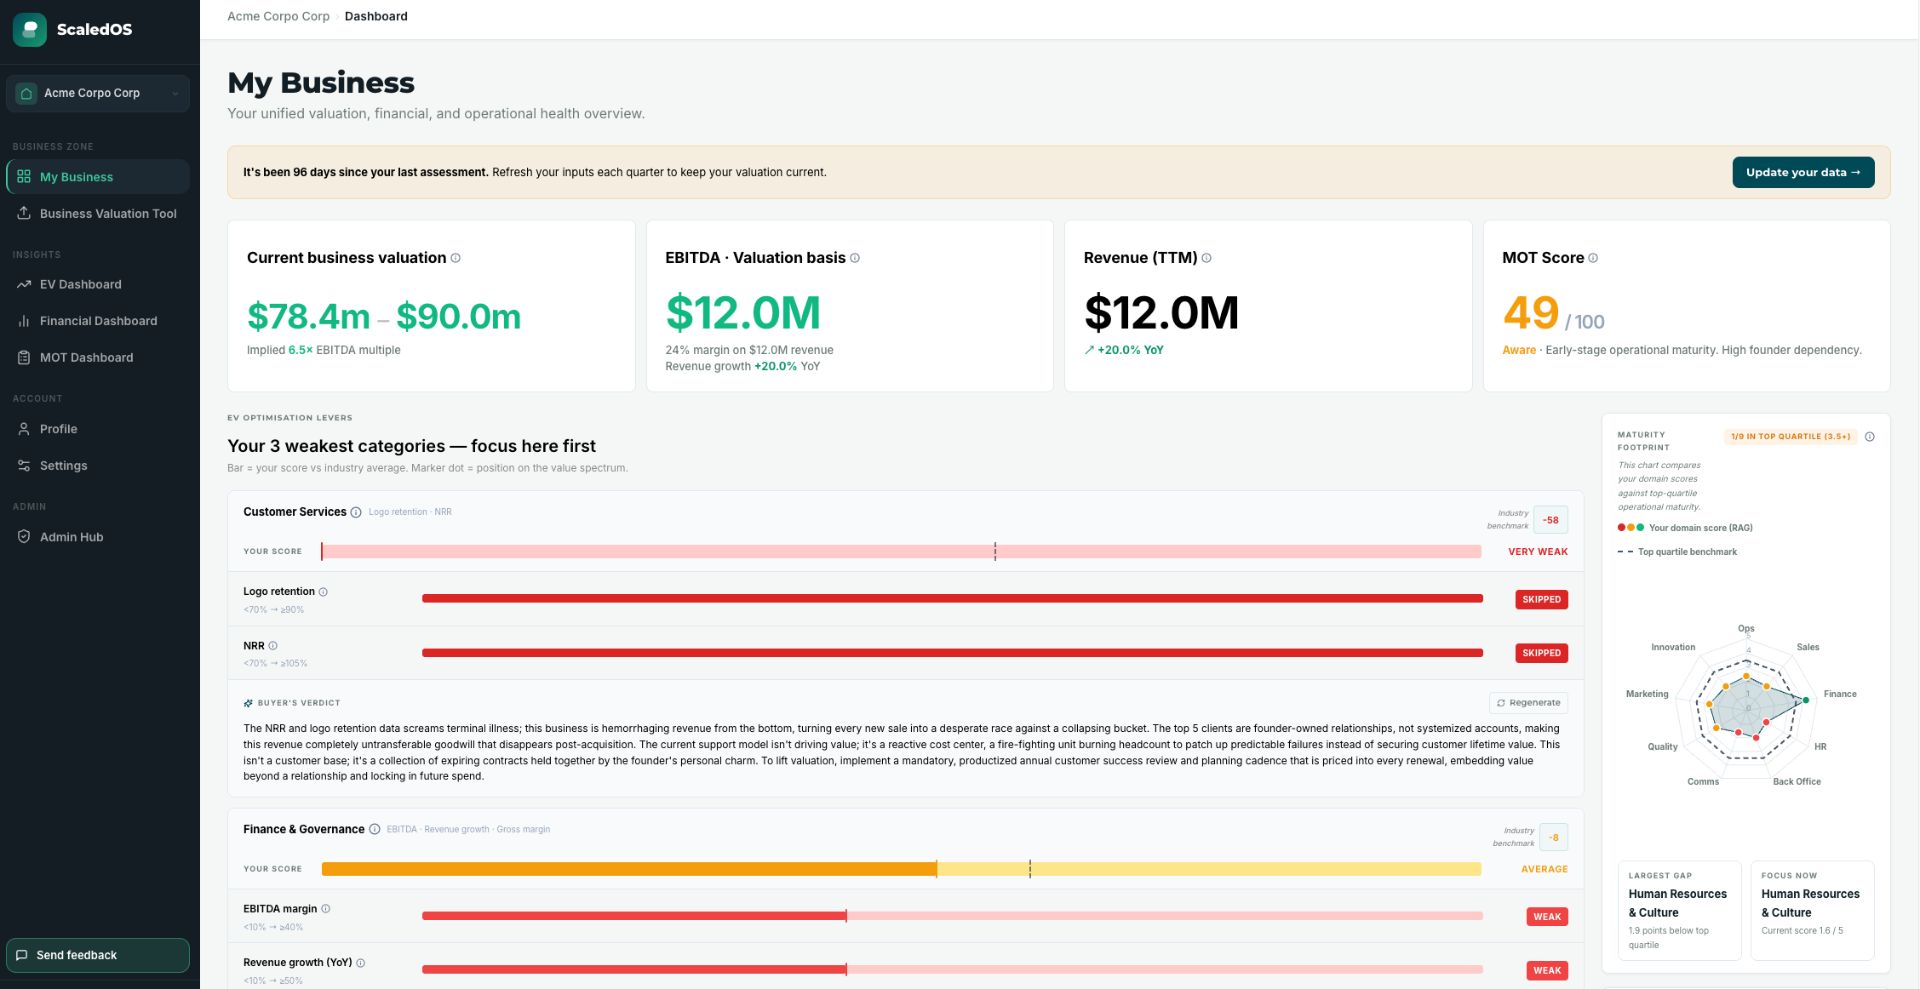
Instantly see your business's estimated Enterprise Value range, your EV multiple, and an overall health score out of 100. Your score is broken down across the key value pillars - Customer Retention, Revenue Quality, Team & Leadership, Market Position, Finance & Controls, Operations & Scale, Growth Trajectory, and Sales & Pipeline - each benchmarked against your industry.
The most accurate directional EV measure available to a founder without hiring an M&A adviser.
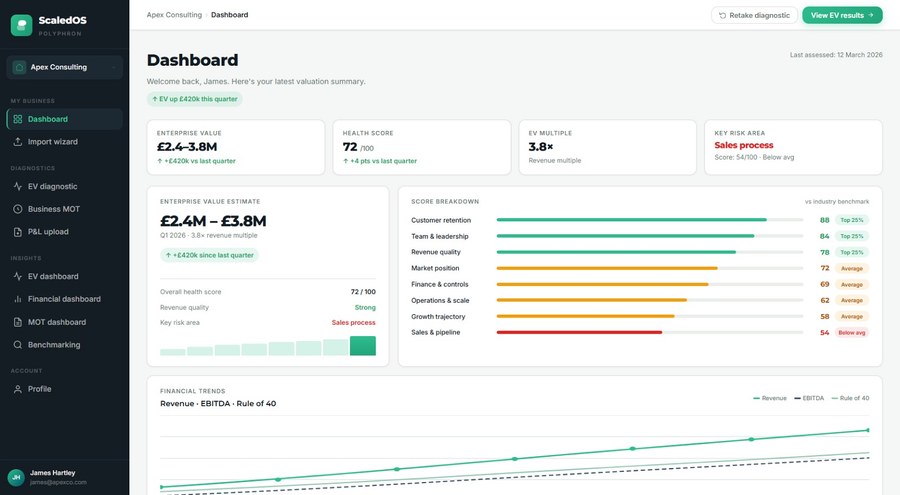
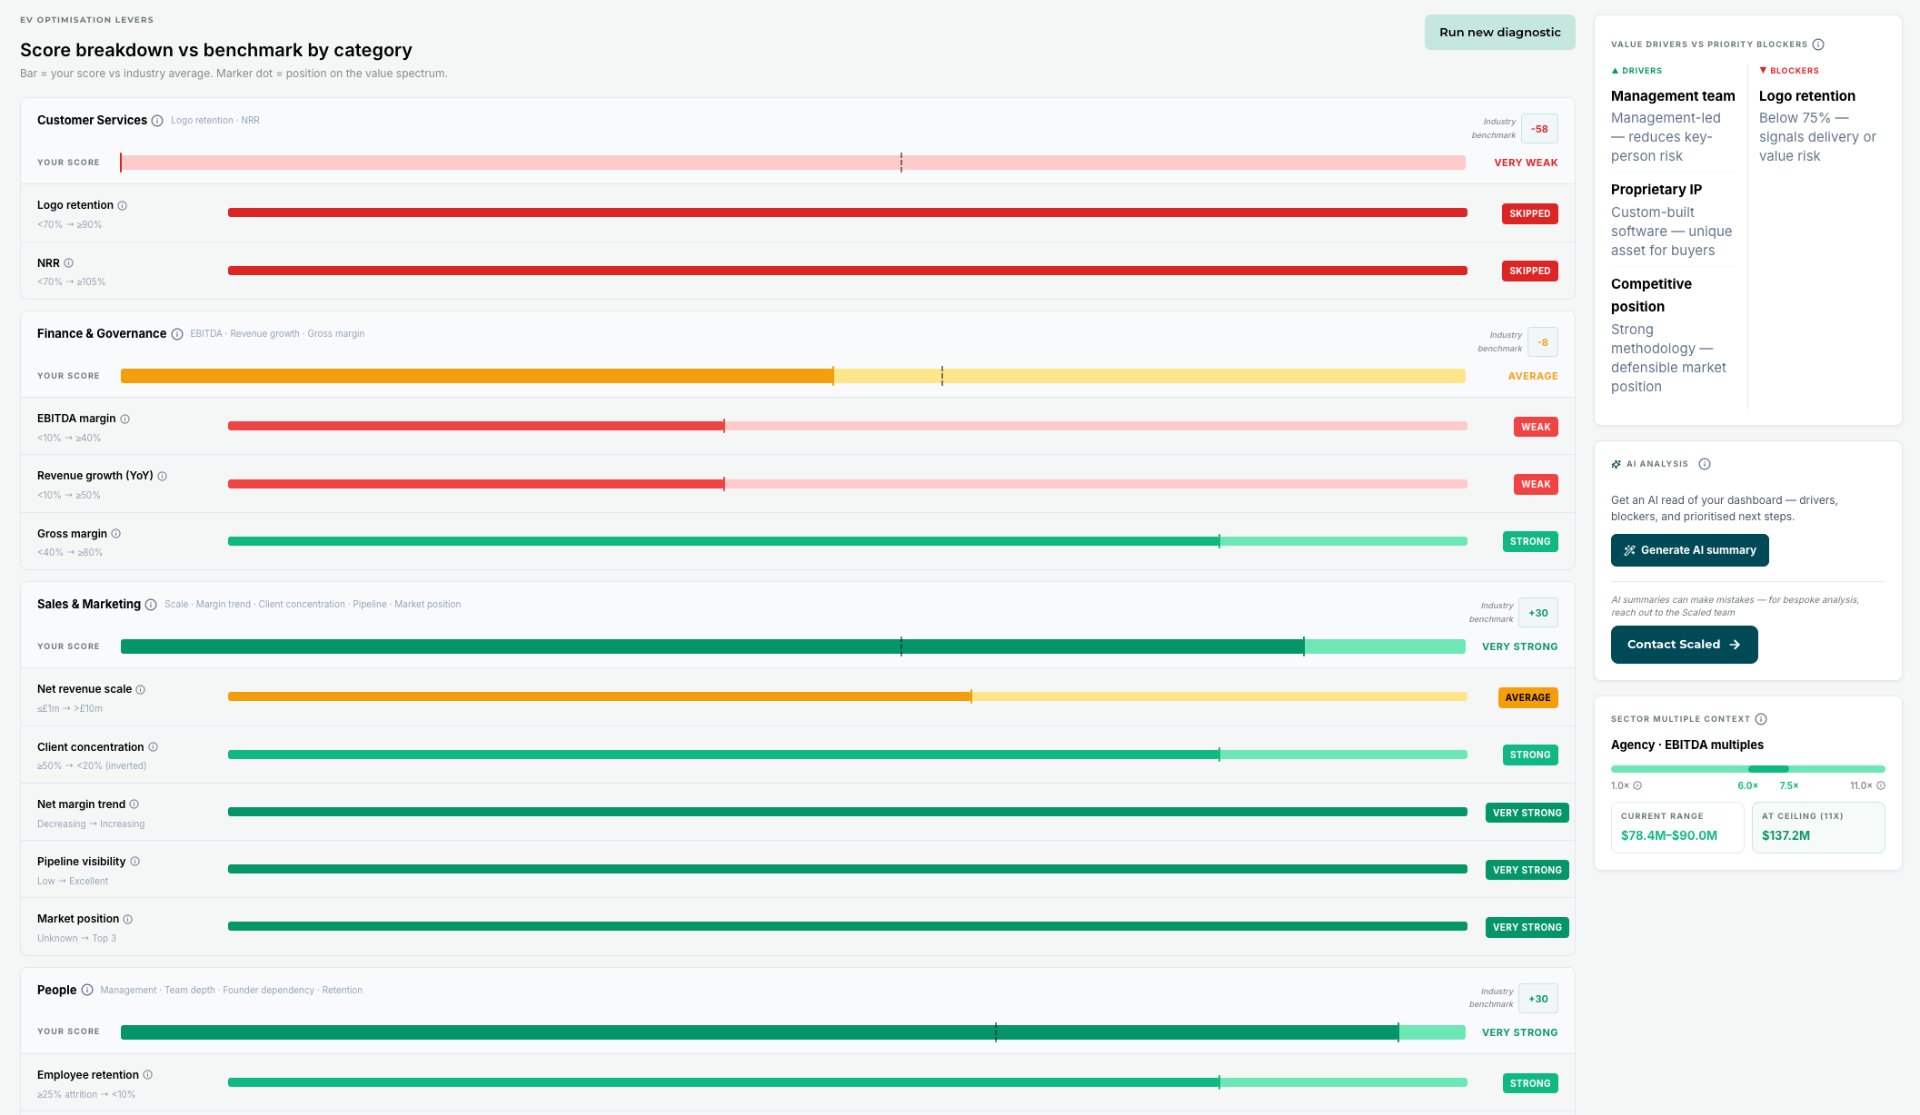
ScaledOS doesn't just give you a number. It tells you why. Every pillar is scored and flagged as Top 25%, Average, or Below Average versus your sector. You'll see precisely where your strengths lie and which areas are the biggest drag on your valuation - ranked by their impact on enterprise value.
No more guessing. No more generic advice. Just a clear, prioritised picture.
Log back in every quarter to retake your diagnostic. Watch your EV score move as you make improvements. ScaledOS tracks your trajectory over time - so you can see the direct impact of your decisions on what your business is worth.
And as we build out the platform, you'll have access to a growing library of tools, templates, and how-to guides - each mapped precisely to your weaknesses - to make it easier than it's ever been to break through those glass ceilings to growth.
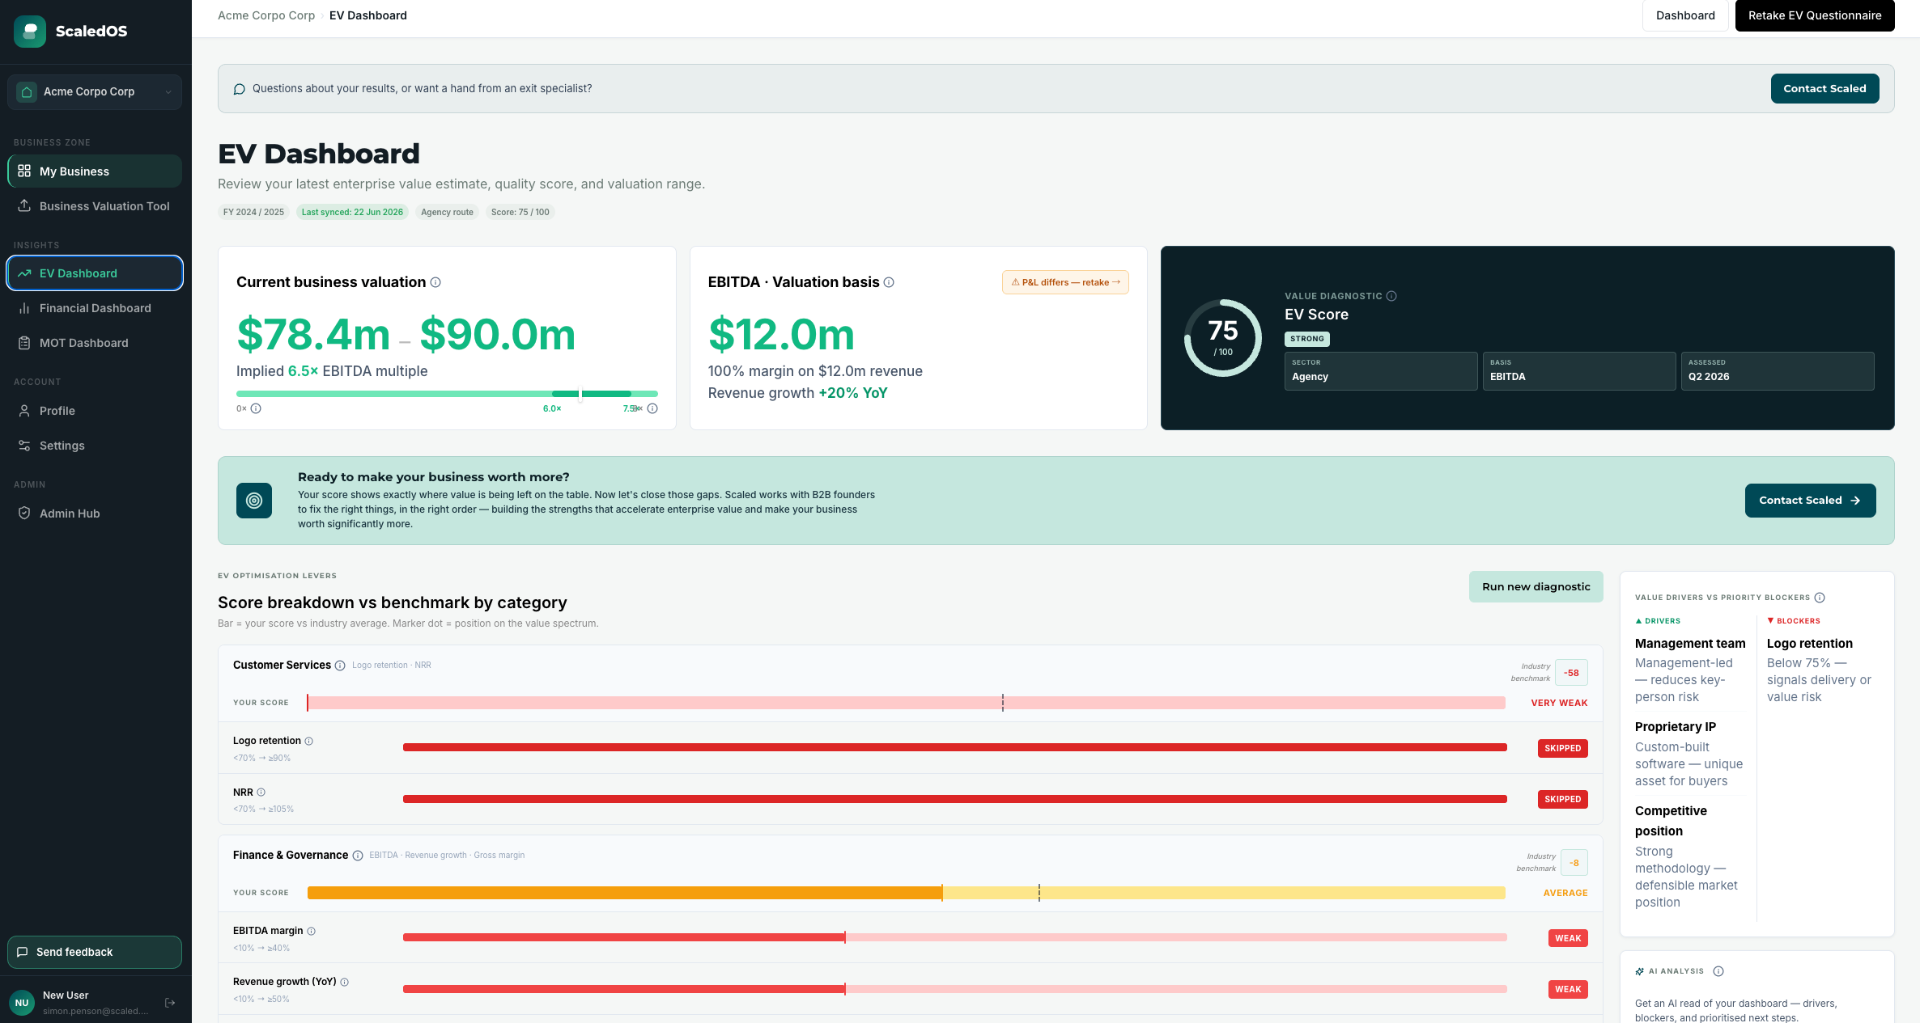
The ScaledOS dashboard gives you a real-time view of your business's enterprise value, health score, EV multiple, and a full score breakdown - updated every time you complete a diagnostic. See what's improved, what needs attention, and what to do next, all in a single screen.
What is your business worth to a buyer - right now?
The EV Diagnostic is the core engine. It does not guess: it uses a scoring framework derived from a real private-equity valuation methodology, the same logic an acquirer's deal team applies when they price a business. The result is a defensible enterprise value range and an EV multiple - not a generic calculator output.
Before a single question is asked, ScaledOS sets a valuation route based on your business model. A SaaS business and an agency are priced completely differently by buyers - the anchor metric, the multiple bands, and the question set all change. Getting that routing wrong is how generic calculators produce meaningless numbers.
| Route | Who it fits | Anchor metric | How a buyer prices it |
|---|---|---|---|
| SaaS | Software and recurring-revenue businesses | ARR | A revenue multiple on recurring revenue - questions probe NRR, ARR growth, churn and product stickiness |
| Service / Agency | Agencies, consultancies, tech-enabled services | EBITDA | An earnings multiple - questions probe delivery model, client concentration and transferable goodwill |
| Hybrid B2B | Mixed-model B2B businesses | EBITDA | A blended read anchored on earnings, with the question set widened to span both shapes |
Financial baseline first - revenue, EBITDA or ARR - then route-filtered qualitative questions across the weighted value-driver categories. Your exact financials pre-fill the banded answers automatically if you have run Financial Intelligence first, so you are not entering numbers twice.
The EV range and health score update with every answer as you work through the diagnostic. You see the direction of travel before you finish - which questions matter most becomes obvious as you go.
The weighting model derives from a private-equity valuation framework obtained on a live deal, benchmarked against 20+ real B2B transactions. The score reflects how an actual acquirer's deal team would price your business - not how a calculator interpolates a multiple from a league table.
The calculation weighting shifts by route: SaaS businesses are scored on growth and retention metrics; agencies on EBITDA margins and delivery stability. The result is a multiple in the right band for your buyer, not an average across every business type.
Enterprise value range - a £M floor and ceiling based on your score and sector benchmarks. Not a point estimate: a defensible range the way a transaction would be framed.
EV multiple - a revenue or EBITDA multiple, correctly anchored to your business model and sector. 3.8x revenue means something different for SaaS than for an agency - the output reflects that.
Health score 0-100 - your overall enterprise value quality score, benchmarked against sector. Drives the score breakdown and the Buyer's Verdict.
Value driver breakdown - each weighted category scored and flagged RAG so you can see exactly which dimensions are holding the multiple down and which are supporting it.
Prioritised action list - the specific fixes ranked by their impact on your EV multiple. Not generic advice: moves derived from your actual scores and the weighting of each driver in your valuation route.
The Buyer's Verdict - a ruthless acquirer's-eye AI teardown of your business, per domain, in the words a deal team would use internally. The part of the output that tells you what a buyer will actually think - not what you want to hear.
As you work through the ~48 questions the EV range and health score update in real time. You see the direction of travel before you finish - which areas are moving the number most becomes obvious as you go.

How healthy is the financial engine behind the number?
A valuation range without a financial health read is half the picture. Financial Intelligence takes your P&L - uploaded or entered manually - and turns it into the margins, growth metrics and benchmarks that a buyer's financial DD will probe on day one. It feeds directly into the EV Diagnostic, so the financial baseline drives the valuation, not the other way round.
Upload a Xero export or CSV P&L and the AI flow - running on paid Google Gemini, with confidence scoring and a full audit trail - parses the figures automatically. Or enter them manually at any time. Your numbers are never used to train any model.
Gross margin %, EBITDA %, people cost %, YoY revenue growth, and Rule of 40 - the standard financial health markers a serious buyer's team will benchmark on first contact. Calculated automatically from your P&L, not entered by hand.
Every derived metric is benchmarked RAG across five tiers - Top 10%, Top 25%, Average, Below Average, Bottom 25% - against anonymised real-company data for your sector and revenue band. You see not just the number but where it sits in the field.
Your exact financials automatically pre-fill the banded financial answers in the EV Diagnostic, with visible provenance pills showing where each figure came from. Removes double entry and ensures the valuation is anchored to your real numbers.
Gross margin % and EBITDA % - with RAG benchmark so you know whether your margins are supporting or suppressing your multiple.
Rule of 40 score - revenue growth rate plus EBITDA margin. The single most-watched financial health metric in B2B SaaS valuation; now tracked for your business automatically.
YoY revenue growth rate - trend-visible across quarters as you re-upload each period, so you can see whether growth is accelerating or decelerating against your sector.
People cost as % of revenue - one of the first ratios a buyer benchmarks in any services or SaaS business. Knowing where you stand before they do matters.
Financial dashboard - all metrics in one view, updated each time you upload a new P&L. The trend line across quarters becomes one of the most useful outputs as the data accumulates.
Every derived metric - gross margin, EBITDA, Rule of 40, growth rate - benchmarked RAG across five tiers against real companies in your sector and revenue band.
How operationally mature is the business a buyer would inherit?
A strong multiple requires more than good financials. Buyers price operational maturity - the robustness of the business beneath the P&L - because that is what they are actually acquiring. The Business MOT is the operational audit Scaled runs by hand with every advisory client, automated and scored across nine domains. It shows you exactly how an acquirer's due diligence team will read your business on the non-financial side.
68 questions across nine weighted domains, each scored 1-5. Each domain maps to a value driver - so the MOT score is not a standalone health check, it is read alongside the EV Diagnostic as a value driver. A low MOT score in Sales & Pipeline is a valuation problem, not just an operational one.
Recurring vs one-off, customer concentration, contract terms and revenue predictability.
YoY growth consistency, forward pipeline confidence and market expansion signals.
Funnel metrics, close rates, pipeline diversity and forward revenue risk.
Key-person dependency, succession depth, leadership capability and team retention.
Reporting accuracy, audit readiness, EBITDA reliability and cash flow visibility.
NPS, churn rates, LTV-to-CAC and the customer satisfaction signals buyers trust.
Process maturity, tooling, scalability and operational resilience under growth.
Competitive moat, brand equity, share of wallet and market perception.
Technology stack, proprietary data, innovation pipeline and the value of your IP.
The MOT scorecard shows every domain flagged RAG, your overall MOT score, and the five operational gaps most likely to attract a buyer's attention - alongside the five highest-EV-impact actions to fix them.
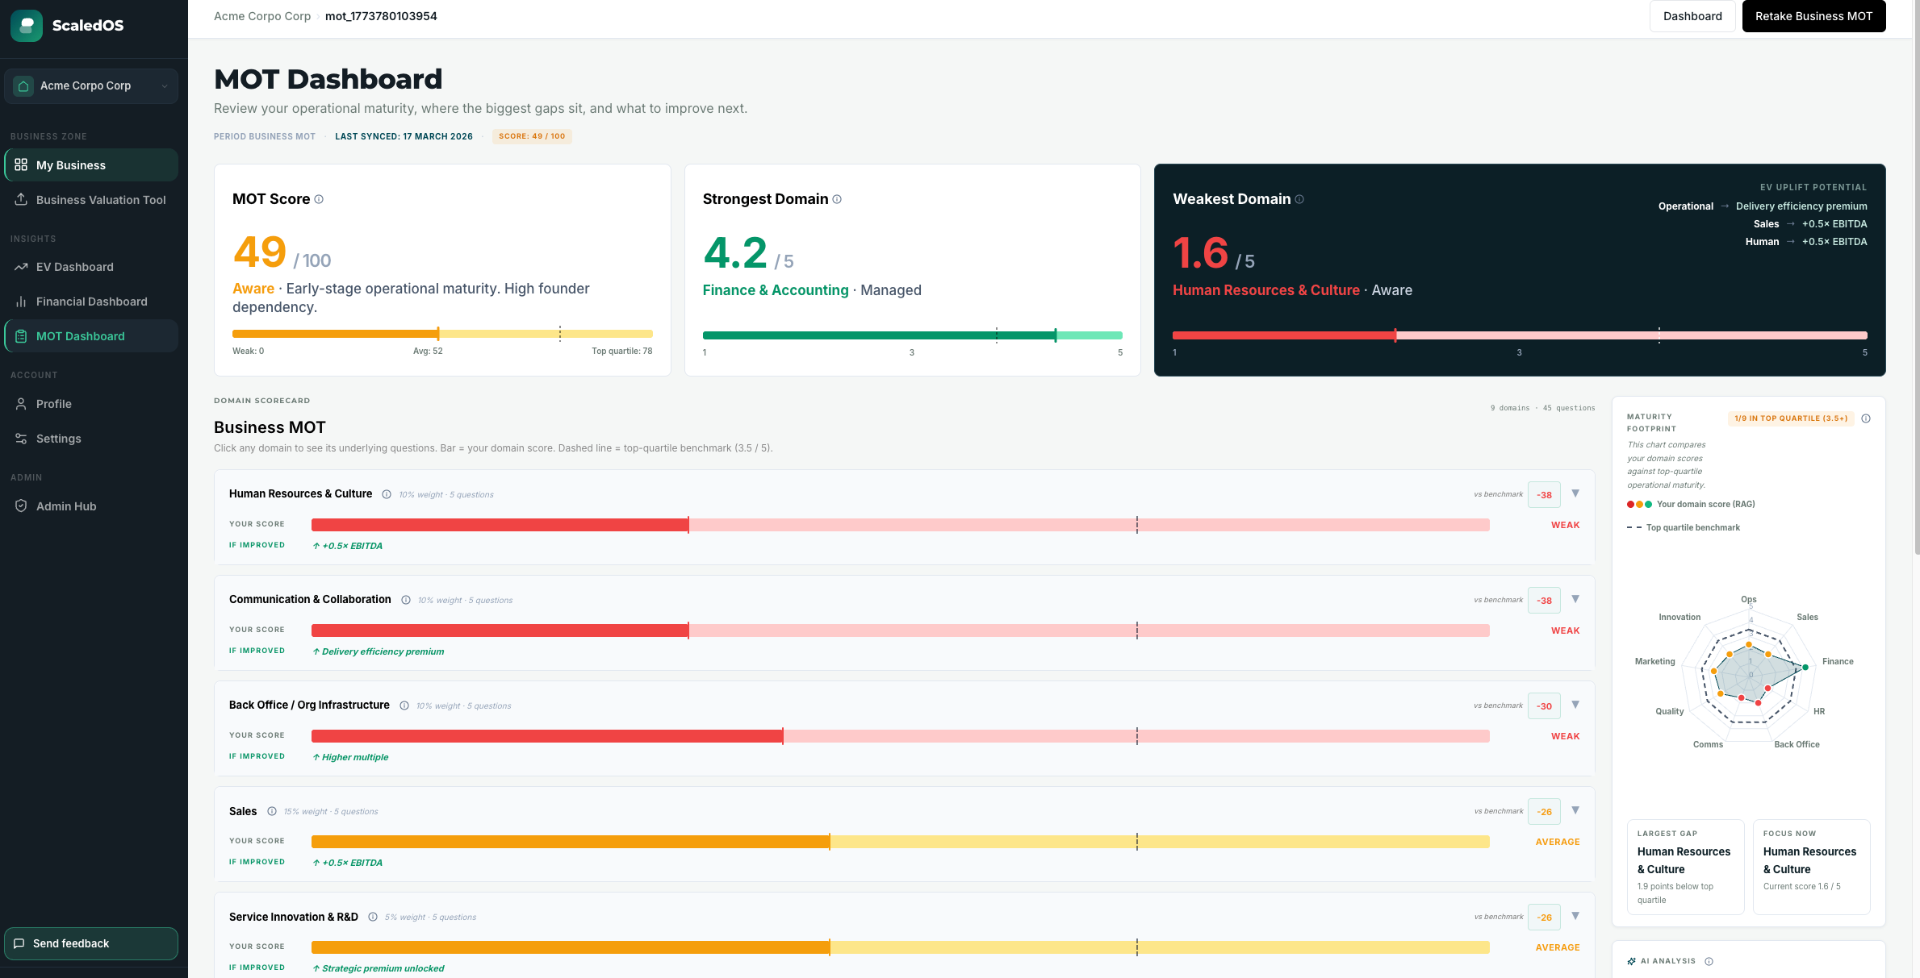
Overall MOT score 0-100 - your operational maturity read, benchmarked against sector.
Sub-scores by domain - each of the nine domains scored individually so you can see which are strengthening your multiple and which a buyer's DD team would flag as risks.
Top 5 value risks - the operational gaps most likely to attract a buyer's attention and result in a price reduction or earn-out condition.
Top 5 priority actions - specific operational improvements ranked by their impact on your EV, derived from your scores across all nine domains.
Cross-correlation to EV score - MOT findings map back to the EV Diagnostic, so the value blockers are visible in a single prioritised list rather than in two separate reports.
"Revenue's grown, but 58% of it sits with three clients - lose one in year two of an earn-out and the model breaks, so I'm pricing that risk in, not paying for it. Founder's still in every sales call: that's not a business I'm buying, it's a job I'm inheriting. Recurring revenue is real and that's what holds the multiple up - but margins are a full six points under what I'd expect for this size, and your reporting can't tell me why. Net: there's a good company in here. Right now I'm paying for two-thirds of it."
Bruising? Yes. That's the conversation coming in your deal room anyway - better to have it now, while you've still got time to fix it. The Buyer's Verdict runs across your EV score, your financial benchmarks, and your MOT sub-scores simultaneously. It surfaces the single valuation-moving fix - the one thing that would move the number most from your current position.
The single most important thing ScaledOS does that no one-shot calculator can is show you the trajectory. Every quarter you re-score, you add a data point to a trend that becomes one of the most powerful things you can show a buyer - a business whose enterprise value has been consciously, visibly, measurably increasing.
Every quarterly assessment is stored. Your scoring history, your financial trends and your MOT progression all accumulate, so the improvement arc is always visible - to you and, when the time comes, to a buyer.
ScaledOS tells you which fixes have the highest EV impact from your current position. When you act on them and re-score, the effect on the range is visible - a direct line between the work you did and the value you added.
A buyer who sees an upward EV trend across six quarters - with the underlying driver data to explain each movement - is looking at a business that has been managed for value, not one that scrambled to prepare. That shifts the conversation and the multiple.
How the quarterly loop works in practice
The three tools are distinct but designed to feed each other. Financial Intelligence anchors the valuation; the EV Diagnostic weights the value drivers; the MOT reads the operational reality beneath both. Together they give you the complete picture a serious buyer would build in due diligence - months before you need it.
Financial Intelligence - quarterly, or whenever you close a period. Anchors the financial baseline.
~20 minutes, quarterly. Financials pre-fill automatically. Get your updated EV range and multiple.
~31 minutes, quarterly. Nine domains scored. Top 5 risks and actions updated. Feeds the Buyer's Verdict.
Synthesises all three signals. The single fix that moves your multiple most - from your current position.
Work the prioritised actions. Return next quarter. Watch the trend. The data compounds; the multiple follows.
Run all three tools free during early access. Get your EV range, your health score, and your prioritised plan. No credit card, no sales call - about 20 minutes to your first number.
~20 min to your first number · Manual entry, nothing to connect · Your data stays yours

ScaledOS is built by Scaled - the advisory team that has worked alongside founders for two decades on the growth and exit moves that lift enterprise value. When the roadmap calls for hands-on help, the Scaled team is one step away.